
Blog Applichem (A) Case Study Solution, Step by Step with...
Read MoreBlog

Applichem (A) Case Study Solution, Step by Step with Excel Solver
UnboxingMBA / Supply Chain Management / Harvard Business School Case Study
Madrid, Spain, last update 2023-09
You’ve landed in the right place! Here you have an MBA graduate explaining the solution for the supply chain management case study “Applichem (A) by Harvard Business School“.
Before the course, I had no idea about Excel Solver. When the professor went through the concept and did a distribution-network design example in the class, I was in a panic. I felt like if I blinked my eyes, I would lose much important information.
And that’s an MBA; other than supply chain management, there were other courses, assignments, group projects, and presentations happening at the same time. I tried to watch YouTube tutorial videos to learn how to use Solver, however, I couldn’t make the linkage with the case study I needed to solve.
I tried to do what you are doing now ( haha =P ), but fortunately or unfortunately, those searched results were either fake, without explanation, or without the most important thing: Excel formulas! You may find some free presentation slides, but it is not helpful if you don’t know how they get those numbers. How do you know those are correct?
To me, the most useful way at that time to learn how to use Solver was to read the class example 3,4 times and practice on a blank Excel sheet until I got the keys to apply it to the case study. I will share the class example in another post; the mission today is to help you out on the Applichem (A).
Brief background of the Case
As usual, there is a lot of information in one case study. I usually like to go to the publication place and have a look at the abstract or learning objective to get an initial idea of what I should focus on. It gives us a brief background on the case.
Never done this before? It’s not another long article; it’s like 8 lines. Check it out now ⇒ ⇒ ⇒ Applichem (A) by Harvard •ᴗ• ⇐ ⇐ ⇐
It’s about a manufactory called Applichem, which has 6 plants in different countries. Our mission is to find out the optimal plans for production and delivery, like whether Plant A should produce this volume and deliver to this and these markets, or whether Plant B should be closed.
On top of the production costs, we also need to consider the transportation costs and import duty when we decide to deliver products from plants to other markets that are not local.
To be honest, this case excited me, except for the part where I spent hours fighting with the Solver. There are more things worth discussing on top of the result from Solver.
Here we will mainly talk about the numerical parts. Even everyone can find the same numbers, but not everyone will plan the same. It depends on your business strategies; you have to use your own judgment and consider market trends, the economy, political factors, etc.
Applichem Case Study Solution
We will use Solver to build models to get the best Total Costs and Production Allocation among the 6 plants.
After you get the know-how to build the model for the current situation, the optimal and alternative solutions are no longer challenging. Of course, you can shop for my full Excel worksheet at any point in time. GOGOGO! Time is money!
Applichem Case Study Solution Content –
The Current Situation
Here is the idea, we can use the Solver to know, under the current production and sales ( the actual 1982 data ), what will be the optimal distribution plan and the optimal costs. To simplify, we will call it “the Current Situation”.
The objectives of doing this are:
To understand how to use the Solver;
To have an anchor for comparison (we need to know where we are now so we know how much we can improve in the optimal solution).
Pay attention that optimal costs are not equal to actual costs; as we only have production and sales data and there are many possible distribution plans, the actual costs may be way higher than the optimal costs.
For example, to meet the sales in Tokyo, Applichem may deliver the products from the Venezuela Plant with the most expensive transportation costs instead of following the optimal distribution plan.
The aim is to have an anchor for comparison.
To achieve this, we need to make 5 tables in Excel as preparation for the Solver.
- Table 1 – Basic Data ( Base Costs & Demand )
- Table 2 – Combined Costs
- Table 3 – Decision Variables
- Table 4 – Constraints ( Excess Capacity )
- Table 5 – Unmet Demand
Then, we can
Step by Step with Excel Solver
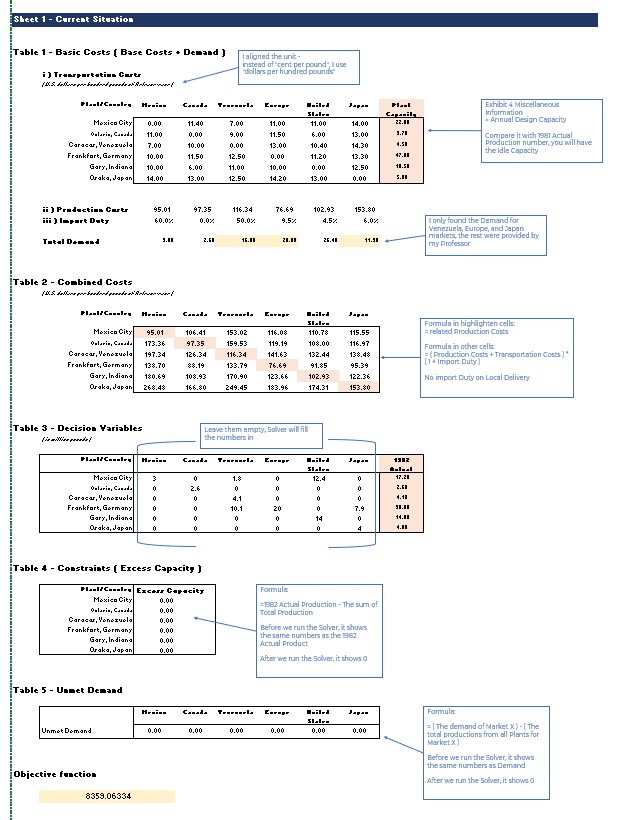
Table 1 – Basic Data ( Base Costs & Demand )
We will go through it step by step. First, we need to table the Transportation Costs, Total Costs, and Import Duty.
To do that, we need to know where these numbers are from.
- i) Transportation Costs & iii) Import Duty – Exhibit 5 ( page 13 of the case study )
- ii) Production Costs – Exhibit 2 ( page 10 of the case study )
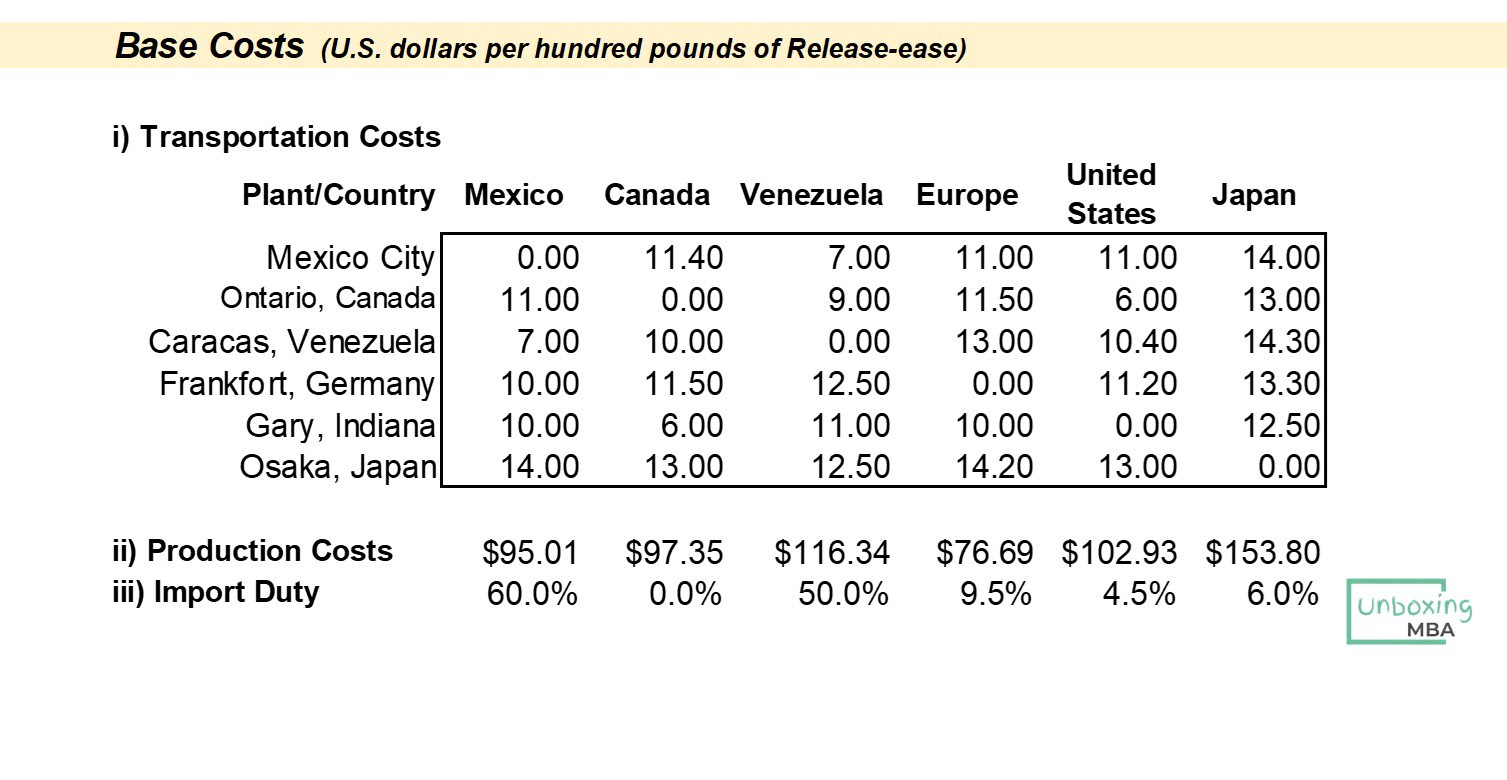
Basically, it is to copy and put the numbers on the Excel table for calculation, but you need to understand their meanings.
[ #1 ] In Part i), the left column shows the name of the plant, the top row shows the name of the market, and the numbers in the middle show the transportation cost to deliver products from the plant to the market. For examples,
- From the Mexico Plant to the Mexico market, the transportation is 0 (local delivery);
- From the Canada Plant to the Mexico market, the transportation is 11.
[ #2 ] Pay attention that, to ease the calculation, I aligned the unit to “dollars per hundred pounds”, which is the same as the unit for Part ii) Production Costs. You may follow the unit on Exhibit 5, which is “cents per pound”. Just don’t mess up when you do the math.
[ #3 ] In Part ii), the numbers refer to the Total Costs in Exhibit 2. The detailed breakdown can be used for other analyses.
[ #4 ] In Part iii), the numbers refer to the import duty that will be imposed on products delivered from other countries, for examples:
- From Canada Plant to the Mexico market, the import duty is 60%.
- From Venezuela Plant to the Mexico market, the import duty is 60%.
( No import duty is imposed on products from local plants )
From the table on page 2 of the case study, the demand is the sales numbers in each region. A small task is to match those regions with the markets. Like Pacific and Rest of World indicates the demand in the Japan market.
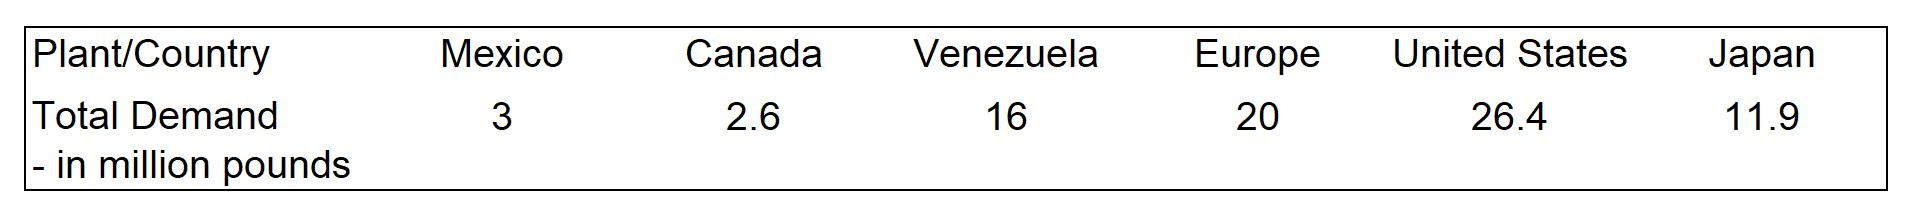
My professor gave us the demand in Mexico, Canada, and the US markets. I have no idea where those numbers come from; I only found the demand in Venezuela, Europe, and Japan. And demand is one of the most critical elements of running Solver.
Table 2 – Combined Costs
Here is the idea –
Based on the numbers in Table 1 – Basic Data, we can get the Combined Costs, which is a more comprehensive way to display the costs among 6 plants.
Transportation Costs + Import Taxes + Production Costs
=Combined Costs
With the numbers in Parts i, ii, & iii of Table 1, we will have the combined costs encompassing transportation costs, production costs, and import duty from each plant to each market.
Combined Costs =
( Transportation Costs + Production Costs ) * ( 1 + Import Duty )
For example:
The combined Cost of products from the Canada Plant that ship to the Mexico market is
( 11 + 97.35 ) * ( 1 + 60% ) = 173.36
Remember the unit in Part i) is aligned? The unit for the Combined Costs is “dollars per hundred pounds”.
You will get a table like this:
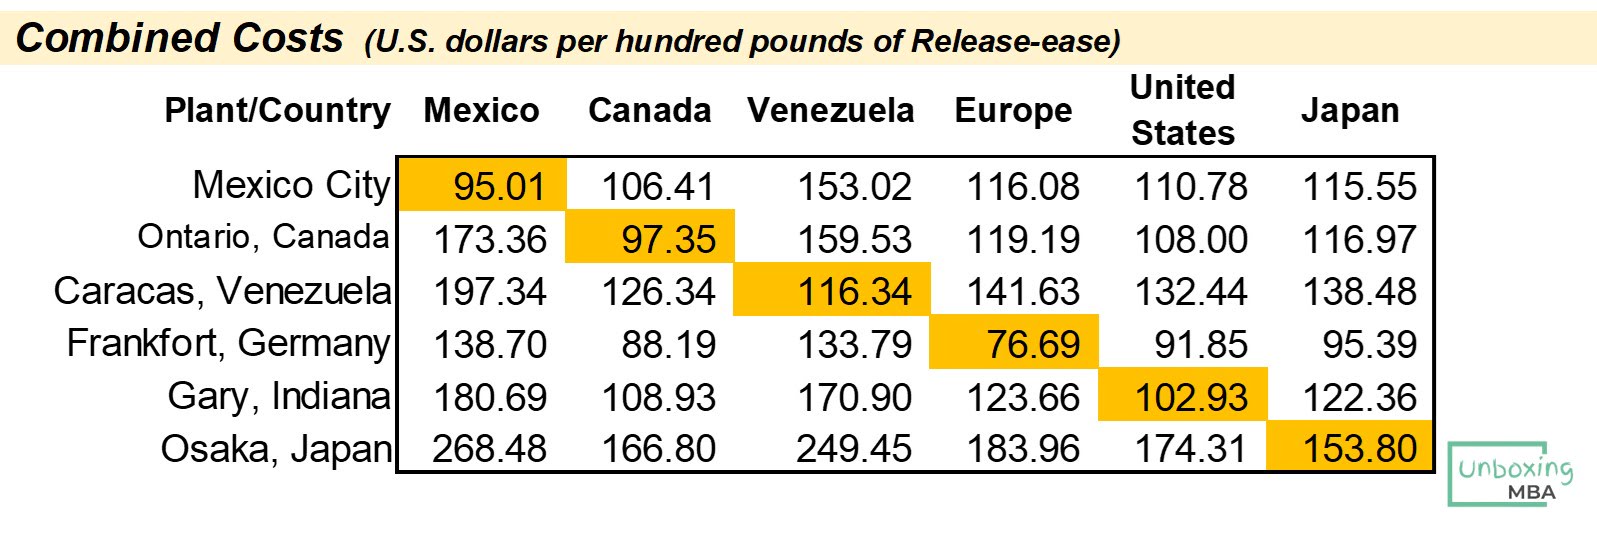
Do you know why some cells are highlighted? Feeling dizzy with numbers? Math makes you bored, annoyed, and sleepy? Shop for my full Excel Worksheet!
Now we are ready to construct the tables to run Solver. The following 3 tables do not need to put any numbers, just formulas, they will be filled by Solver.
The importance is that we need to understand the meaning of these tables to interpret the results.
Table 3 – Decision Variables
This is the Production and Delivery plan. Solver will give us the solution based on the constraints we set. It’s like a box to communicate with Excel. Solver will fill in the numbers in this Decision Variables box. No formula needs to be set; just leave the cells on the table empty.
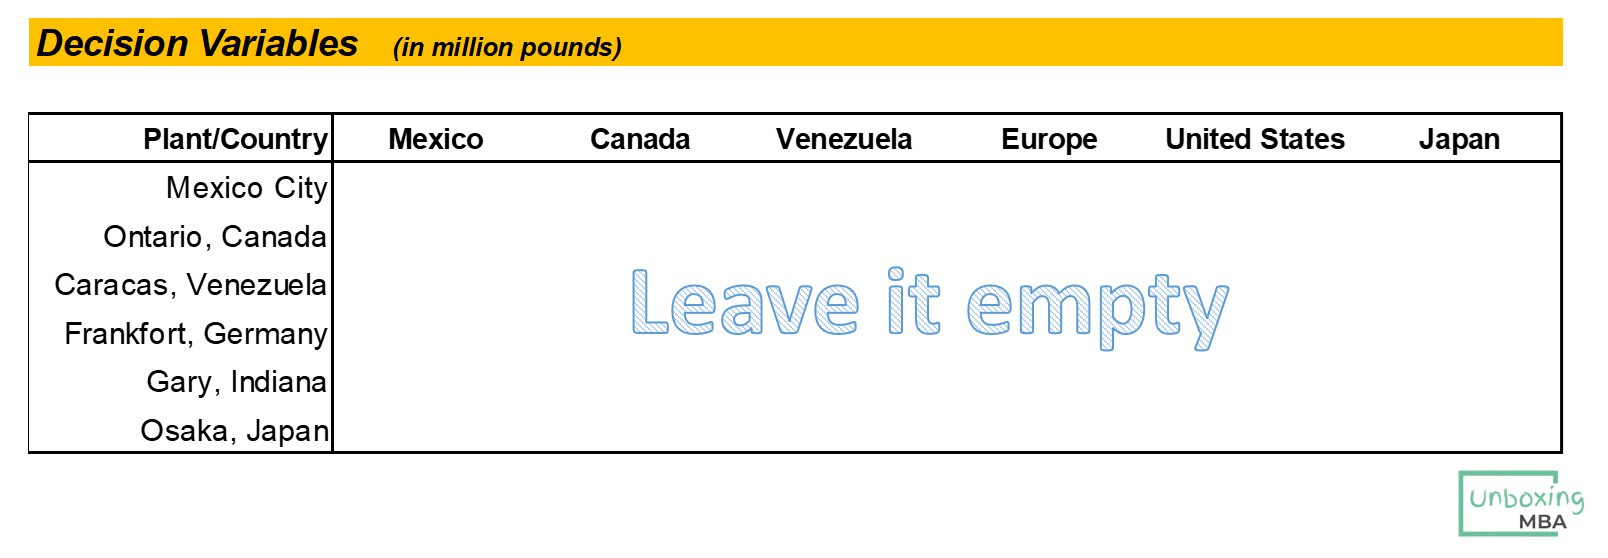
Table 4 – Constraints ( Excess Capacity )
This table will show the excess capacity, which indicates the difference between the volume produced and the plant capacity, a.k.a. the idle capacity.
For example, when the volume produced is 3 and the plant capacity is 5, the excess capacity is 2. Ideally, we want 0 excess capacity. Quick question: do you think it can be a negative number?
Here is the trick, we are now trying to get the delivery plan under the current situation, so we can get the costs as an anchor. The volume produced in each plant is equal to the actual 1982 production ( page 2 of the case study ).
We need to set a formula, that’s
= (The Actual 1982 Production of Plant X ) – (The sum of total production of Plant X)
We will set the constraints ” > = 0 ” ( greater or equal to Zero ) later in Solver. Here we just input the formula in the table.
Nothing will be shown after we enter the formulas, because we need to run the Solver to get the total production of Plant X.
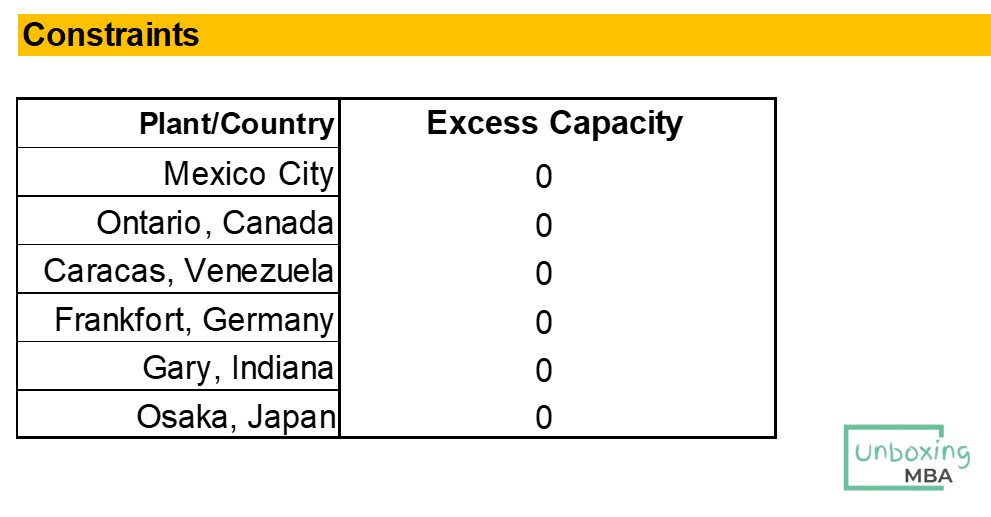
Where can I find the sum of the total production of Plant X? You will find them in Table 3 after we run the Solver!
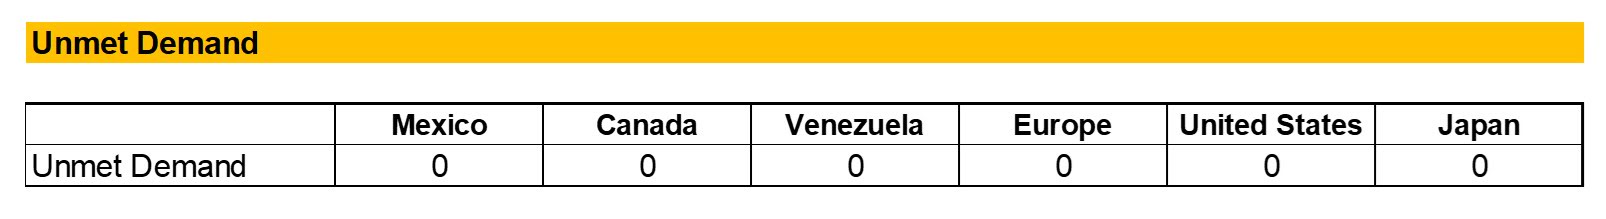
Table 5 – Unmet Demand
We want what we produced to meet market demand, so the ideal case is 0 unmet demand, and the formula is,
= ( The demand of Market X ) – ( The total productions from all Plants for Market X )
Again, we will set the constraints to “>=0” ( greater or equal to zero ) later in Solver.
Set an Objective Function and you’re ready to go!
One step before we run the Solver, we need to have a cell for the Objective Function so we can get the cost.
We will use our production and delivery plan times the related combined costs; the sum is the total cost under this plan.
=SUMPRODUCT ( Combined Costs table , Decision Variables table )
Run the Solver!
We are ready to run the Solver!
First, select the cell that will display the Objective Function (the one with the SUMPRODUCT formula).
Go to Data > Solver, you will see a box like this:

If you don’t have Solver in your Excel, look for Add-ins in Options , and add it for free.
| Solver | Settings |
|---|---|
|
Set Objective: |
the Cell we selected
( with the SUMPRODUCT formula ) |
|
To : |
Select "Min" |
|
By Changing Variable Cells: |
Select All the EMPTY cells in Table 3 Decision Variables. Empty cells only |
|
Subject to the Constraints: |
Add 3 Constraints. Only select the empty / blank cells in the tables 1. Decision Variables >= 0 2. Excess Capital >=0 3. Unmet Demand = 0 |
|
Make Unconstrainted Variables Non-Negative |
Tick it |
|
Select a Solving Method |
Simplex LP |
Select “Solve” , then we will have tables 3,4,5 filled, and the Total Cost in the Objective Function.
The optimal total costs under the current situation are $8,359. It’s important to repeat 3 times – It’s the optimal total costs, not necessarily equal to the actual total costs. As they may not have followed the optimal solution to distribute the products in 1982.
The objective of finding the delivery plan and the optimal total costs under the current situation is to have an anchor for comparison and proof that the way we are using Solver is correct.
Not confident enough? Shop for my completed Excel Worksheet here:
To get
- 1 tab – Current situation
- 1 tab – Optimal solution
- 1 tab – Guide to Formulating Alternative Solutions
The Current situation and Optimal Solution are rigid; everyone may get the same numbers; alternative solutions are the part to show considerations and strategies.
I got an A •ᴗ• in this assignment – building the models is the foundation to form strategies, make recommendations, and extend the ideas. There is no standard answer; the ability to form, interpret, and support your standpoint is the key to scoring well.
My Excel worksheet is a tool to help you build your own ideas. You can allocate more time to the important parts.
All my sharing is based on my best knowledge; I’m neither a professor nor an Excel guru. I write from the perspective of my own learning experience, how I understood the application of the solver, and how I used it on this case study.
The Optimal Solution
With the same methodology (basically same model), you can get an optimal solution with a production and delivery plan.
The trick is that in Table 4 constraints, use Plant Capacity instead to minus the total production.
What you have to prepare the most for the course is how to take notes. I used OneNote to take screen shots and write my notes on them, but they were messy (maybe it’s my own problem). I had difficulties reviewing my notes and recalling the logic behind them. I saw others mark notes directly on the coding page by using “#”.
Alternative Solutions
It’s your call! You play with Excel by increasing / lowering the capacities of each plant, increasing / lowering the demand (forecast of demand, etc.).
Let’s say if you think to shut down the Japan Plant, just enter 0 capacity; if you think to increase the capacity of the Mexico Plant, just increase the capacity number. Run the Solver, and you will have the plans, idle capacity, and total costs.
And you need to support your judgment by taking into consideration market forecasts, trends, labor costs, the economy, and political factors.
My Excel worksheet is waiting for you to shop! Don’t you want to see how I construct my alternative solutions?
I have no doubts that you can build models for the current situation and optimal solutions. With my Excel as a reference, maybe it will inspire you to create yours! It will be the most valuable part.
At the end,
I am an MBA graduate, and I went through the pain of doing a lot of case studies with short deadlines. I always wanted to do everything on my own, partly because I am an introvert and partly because my conceit didn’t allow me to ask for help.
I perfectly knew that discussing and interacting with fellow classmates is also part of the value of going for an MBA, but I wanted to save all discussion for meaningful topics, not “how to use Solver”.
I wish there were more resources on the internet, and I hope my sharing helps you out, gives you more options, and lights up your day. •ᴗ•
If you want to know more about me, follow me on IG, Facebook, I share everything about studying MBA abroad, encompassing study, life, networking, etc. Stay connected today.
Also Also,
You can also Buy Me A Coffee! Your support is much appreciated!
Have a lovely day! Cheers!
#MBA #unboxingMBA #MBA CaseStudy #SupplyChainManagement #Applichem #Applichem(A) #ApplichemCaseSolution #ApplichemCaseStudySolution #Applichem(A)Solution #Applichem(A)CaseStudySolution #Applichem(A)CaseSolution
If my sharing makes some difference to your life, you could absolutely make the same difference to mine. As little as $5, you'll make my day!


